
20 Likert Scale Questions and Examples

Named after psychologist Rensis Likert, these scales are a firm favourite for customer surveys. A Likert scale is basically a psychometric tool that’s used to measure how people are really feeling. Rather than the basic ‘Yes’ or ‘No’ answer, these scales allow you to gauge the specific attitudes, opinions and experiences that people have with your brand, products and services.
In this post, we’ll look at:
- What a Likert scale is
- How a Likert scale works
- The various types of Likert scale
- Advantages and disadvantages of Likert scales
- 20 sample Likert scale questions
- How to analyse your answers
- Likert scale FAQs
What is a Likert Scale?
You have almost certainly encountered a Likert scale, even if you did not know it had a name. It is the standard format for quick check-ins after a customer service call, a hotel stay or a repair. Beyond customer service, it is also a staple of Likert scale psychology, where researchers use it to measure personality traits and attitudes.
Instead of forcing respondents into a binary choice, a Likert question offers a range of options and asks people to pick the one that best matches how they feel. With a five-point Likert scale, a customer can record that they are happy, satisfied, dissatisfied, or genuinely neutral and those answers convert directly into quantitative data for analysis.
Likert scales are well suited to turning opinions into a Likert chart you can track over time. They are less suited to explaining those opinions: a score tells you that something is wrong, not why. That is a real limitation, and it is why the most useful Likert surveys pair a simple scale with a follow-up question.

What is an Example of a Likert Scale?
The classic five-point Likert scale is the natural starting point. It has been the most widely used format since Likert introduced it in 1932, largely because everyone already knows how it works. Answers typically run from ‘Strongly agree’ to ‘Strongly disagree’, with graded options in between.
A typical Likert scale question looks like this:
How satisfied are you with the service you have received from [brand, department, service agent]?
The respondent might be offered this 5-point Likert scale from which to select a response.
- Very satisfied
- Moderately satisfied
- Neither satisfied nor dissatisfied
- Moderately dissatisfied
- Very dissatisfied
The neutral midpoint matters. It gives respondents who genuinely have no strong view a way to say so honestly, rather than pushing them towards a verdict they do not hold.
You can extend to a 7-point Likert scale or a 9-point Likert scale if you need finer gradations, but we would advise caution: every option you add increases the effort of answering, and effort is what causes drop-outs. Start with a 5-point Likert scale, and use follow-up questions to add depth where you need it.
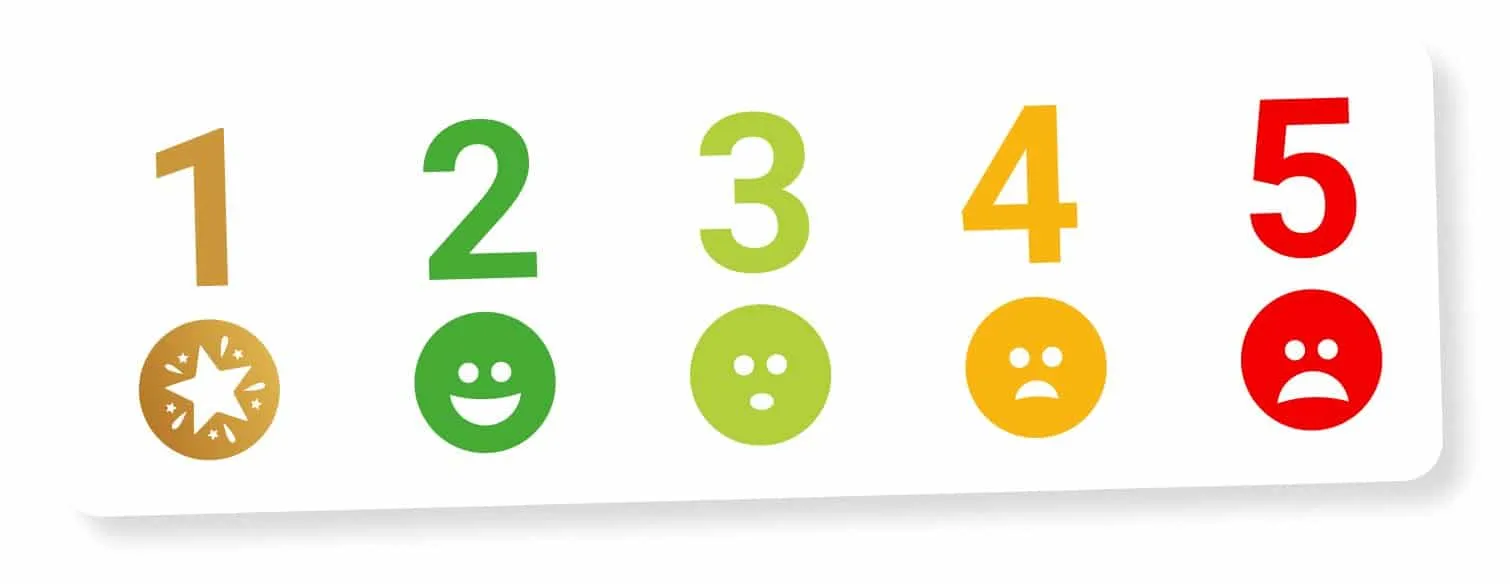
Five-Point vs. 7-Point Likert Scale – Which One Should You Use?
The choice comes down to your goals and how much you are asking of your respondents. The 5-point scale is popular because it is fast, simple and requires little thinking time. If you want a quick pulse check on how things are going, it is the right tool.
A 7-point Likert scale earns its place when you need room for subtler differences of opinion – typically in research settings rather than day-to-day feedback. The trade-off is real: offer too many options and some respondents will struggle to place themselves and give up altogether. In our experience, the simple surveys are the effective ones.
However, the best practice is to offer fewer choices. You can then probe deeper with a follow-up question to uncover the reasons why.
Even vs. Odd Likert Scales – What’s the Difference?
The difference is whether you allow a neutral answer. An odd scale (5, 7 or 9 points) has a midpoint, which lets people be honest when they are unsure or genuinely indifferent. Since Likert scales were first introduced, there has been a lot of research into the optimal number of multiple choice answers. It has been argued (Garner (1960)) that the more response options offered maximises the amount of information gathered but others (Green and Rao (1970)) have indicated that 7 response options was optimal. You tend to find that, while 5 options is the most common, most academics advocate 7 options.
An even scale, such as a four-point Likert scale or a 6-point Likert scale, removes the middle ground. These are often called forced-choice scales, because respondents must lean one way or the other. That is useful when you need a definitive verdict, combined with a follow up question, will often elicit the best response rates and actionable insight.

When to Use a Likert Scale?
Use a Likert scale when a binary choice will not capture what you need to know. A dichotomous questionnaire works for gathering facts; Likert scales are the better choice when the answer sits somewhere on a spectrum.
Consider the difference in practice. Ask a customer whether they are happy and many will say yes out of politeness. Ask a likelihood Likert scale question instead – “How likely are you to shop with us again?” – and you get a more honest reading of where you stand. This is the same principle behind Net Promoter Score surveys, which look past in-the-moment satisfaction to long-term loyalty.
The same applies internally. Rather than asking employees whether they have what they need, use a confidence Likert scale and ask them to rate the statement “I feel confident using the new software”. Low scores tell you immediately where training is needed.
The Pros and Cons of Likert Scales
Likert scales are an efficient way to take the temperature of your respondents, but they have limitations. The table below weighs the advantages against the drawbacks, so you know what your data can and cannot tell you.
| The Advantages | The Disadvantages |
|---|---|
| Simple and straightforward: Likert questions and answer options fit into any survey, and respondents understand them without instruction. | Limited depth: With a fixed set of answers, a Likert scale will not always capture the full attitude or opinion behind a response. |
| Data-ready: Quantifiable answers support statistical analysis, reporting and visualisation. | Influence of context: A respondent’s answer can be swayed by the questions that came immediately before it. |
| Familiar: Most people have completed Likert surveys before, so there is no learning curve to depress your response rate. | Avoidance of extremes: Some respondents shy away from the strongest options, even when those options are the accurate ones. |
| Room for nuance: They record a range of opinion rather than a black-or-white ‘Yes’ or ‘No’. | A hiding place for indifference: Offer a midpoint and some respondents will sit on the fence rather than take a position. |
What Can You Measure With a Likert Scale?
Before building a survey, decide exactly what you want to measure.
A Likert scale works by offering two contrasting extremes – ‘Extremely satisfied’ and ‘Extremely dissatisfied’, say – with balanced options in between. That structure lets respondents quantify an experience, opinion or attitude.
Satisfaction is the obvious use, but far from the only one. Likert scales can measure almost any attitude, including:
- Satisfaction – from ‘delighted’ to ‘frustrated’
- Importance – from ‘essential’ to ‘unimportant’
- Quality – from ‘extremely high’ to ‘very poor’
- Frequency – from ‘often’ to ‘never’
- Likelihood – from ‘definitely’ to ‘never’
Whatever you measure, the options between the extremes should let respondents place themselves as accurately as possible.
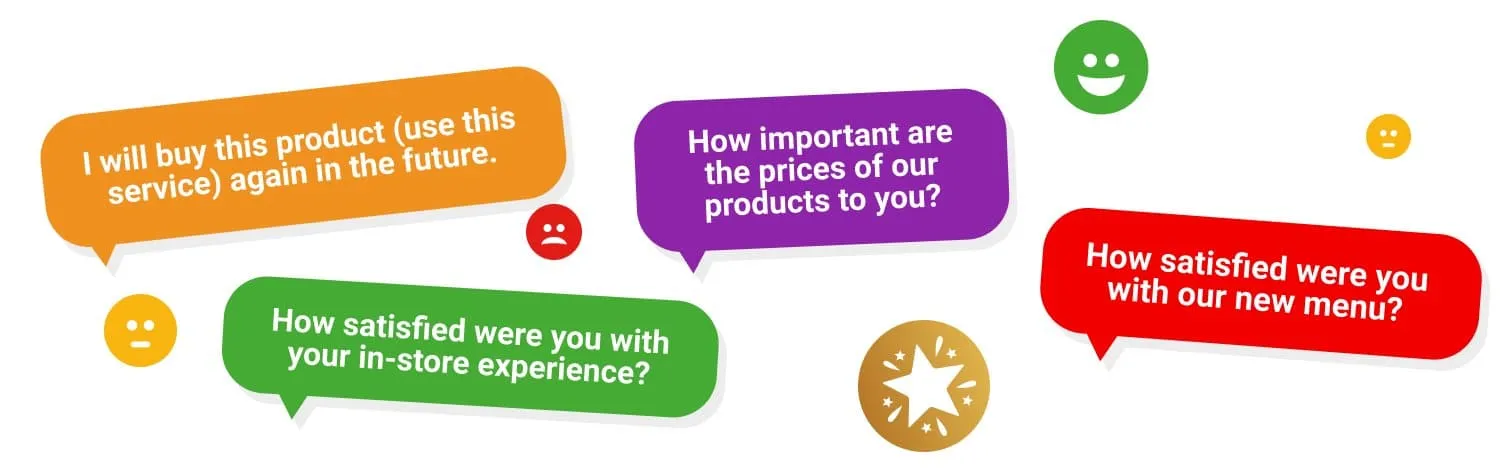
20 Likert Scale Question Examples
A Likert scale can carry as many answer options as you like. In our experience, fewer is better. The less effort a survey demands, the higher your response rate – so make answering as effortless as you can.
Our recommendation: lead with key questions and a small set of clear answer options, then follow up with anyone who was unhappy to understand their experience in more depth. That sequence produces actionable feedback faster than a long questionnaire ever will.
The 20 examples below are grouped by category, so you can go straight to the section that fits your use case. Most use even, forced-choice scales, which push respondents towards a clear verdict; add a neutral midpoint if honest indifference is a result you want to capture.
Customer Satisfaction Examples
How satisfied were you with your in-store experience?
- Delighted
- Satisfied
- Dissatisfied
- Frustrated
The online store checkout process was straightforward.
- Strongly agree
- Agree
- Disagree
- Strongly disagree
It was easy to navigate the website to find what I was looking for.
- Strongly agree
- Agree
- Disagree
- Strongly disagree.
What do you think about our online prices?
- Very happy
- Happy
- Not very happy
- Not happy at all
How important are the prices of our products to you?
- Very important
- Important
- Low importance
- Not important at all
How likely are you to recommend this product / service to friends and family?
- Very likely
- Likely
- Not likely
- Very unlikely
I will buy this product (use this service) again in the future.
- Very likely
- Likely
- Unlikely
- Very unlikely
Product Experience Examples
What was your level of satisfaction with our product(s) (or service)?
- Extremely satisfied
- Very satisfied
- Slightly dissatisfied
- Not satisfied at all
The product is manufactured from high quality components and materials.
- Strongly agree
- Agree
- Partially disagree
- Totally disagree
Please tell us how important the new features added to [product] are to you.
- Highly important.
- Moderately important
- Low importance
- Not important at all
The user-manual provided clear guidance in how to install and setup the application.
- Completely agree
- Mostly agree
- Slightly disagree
- Completely disagree
How helpful are the instruction videos provided from our website?
- Extremely helpful
- Somewhat helpful
- Not very helpful
- Not helpful at all
How important is the product warranty to you?
- Very important
- Important
- Low importance
- Not important at all
Service & Event Feedback Examples
How would you rate your recent customer service call?
- Exceptional
- Good
- Fair
- Poor
To what extent did our customer service team meet your expectations?
- Significantly exceeded expectations
- Met expectations
- Did not meet expectations
The conference speakers were knowledgeable and informative.
- Strongly agree
- Agree
- Slightly disagree
- Totally disagree
How satisfied were you with our new menu?
- Very satisfied
- Reasonably satisfied
- Slightly dissatisfied
- Very dissatisfied.
[Brand / organization] invests time and effort to keep employees updated with changes.
- Strongly agree
- Agree
- Disagree
- Strongly disagree
How often do you seek assistance from customer support?
- Very frequently
- Occasionally
- Rarely
- Never
Please tell us how important it is for us to provide 24/7 customer service.
- Essential
- Important
- Low importance
- Not important
Easy Ways to Analyse Likert Scale Surveys
Likert scale data is ‘ordinal’: you can tell that one score is higher than another, but not by how much. The gap between ‘Strongly agree’ and ‘Agree’ is not a measurable quantity, which means the data needs slightly more careful handling than it first appears. Four practical approaches:
- Treat averages with caution
Tagging each answer with a number does not make those numbers valid scores to add up – there is no meaningful average of a smiley face and a frowny face. An average of ordinal data can mislead more than it informs, so do not lean on it as your headline figure.
- Focus on the mode
The mode is the answer that appears most often, and it is the quickest reliable way to see how the majority of your respondents feel. It is also robust: unlike an average, it cannot be dragged around by a handful of extreme answers.
- Use bar charts
A bar chart shows the mode at a glance (the tallest bar) alongside the spread of every other answer. It is also the right format for presentations, since an audience can read the overall picture instantly.
- Put your data in a table
Bar charts are for viewing at a glance; tables are for digging deeper. Tabulating results lets you compare groups side by side – whether your support team is scoring higher than your sales team, for instance – and shows quickly which areas are performing and which need attention.
Start Sending Likert Scale Surveys Today
Customer Thermometer lets you build Likert scale surveys in whichever format suits your goal – 5-point, 7-point or in between – with response options your customers can answer in a single click, without feeling overwhelmed.
Adding a follow-up second question is straightforward too, so you can capture the ‘why’ behind any answer that needs one. A trial account is free, with no payment details required. Complete the form below to send your first survey today.
Your name *
Your company *
Your email address *
Your password *
Comments
Likert Scale FAQs
What is a Likert scale in simple terms?
A Likert scale is a survey question that offers a range of answers between two contrasting extremes, such as ‘Strongly agree’ and ‘Strongly disagree’, rather than a plain ‘Yes’ or ‘No’. The respondent selects the option that best matches their experience or opinion, and the graded answers in between the extremes provide the middle ground.
What is a 5-point Likert scale example?
A 5-point Likert scale is a survey question with five answer options: two extremes, a neutral midpoint, and two balanced options in between. For example:
“My customer assistant was friendly and helpful when dealing with my issue”
- Strongly agree
- Somewhat agree
- Undecided
- Somewhat disagree
- Strongly disagree
Is a 5 or 7-point Likert scale better?
A 5-point scale is better for most business feedback; a 7-point scale is better for research. The 5-point format is fast to complete and produces clean, easy-to-read data, which is what everyday customer and employee surveys need. A 7-point scale gives respondents more room to be precise and can track small shifts in opinion that a 5-point scale would miss, which makes it the stronger choice for research and psychological studies.
What are Likert scale questions used for?
Likert scale questions are used to measure attitudes, opinions, behaviours and experiences – anything that sits on a spectrum rather than a binary. They are most commonly used to track customer and employee feedback on products, services and overall experience, and they also appear in psychological and clinical assessment. In each case the purpose is the same: turning subjective feelings into clear data you can track over time.
What are the advantages and disadvantages of Likert scales?
The main advantage of a Likert scale is familiarity: most people have completed one before, so they can respond without instructions, and the graded answers give you more insight than a ‘Yes’ or ‘No’ – you learn not just whether someone liked your product, but how strongly. The main disadvantage is that scores do not explain themselves. You can see that a customer was unhappy, but you will not know why unless you pair the scale with a follow-up question.