
Reporting Ribbon launch 🎀
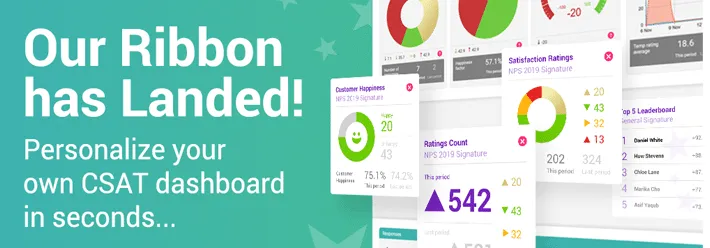
We’ve never been quite as excited about a release as we are today!
We’re thrilled to release into the wild our brand new 🎀 Ribbon 🎀 reporting feature. You can now make your own completely customized dashboard ribbon of mini reports to suit your team and your business!
What is it? And show me some examples!
Ribbon is a brand new reporting feature in our main visual report, Misson Control. For Jumper plans and above, as soon as you log in you’ll be able to see it and click to create your own, completely unique-to-you strip of reports. So, you can isolate and display key and interesting data, immediately as the first thing you see in your CT account. Hang tight for those examples…
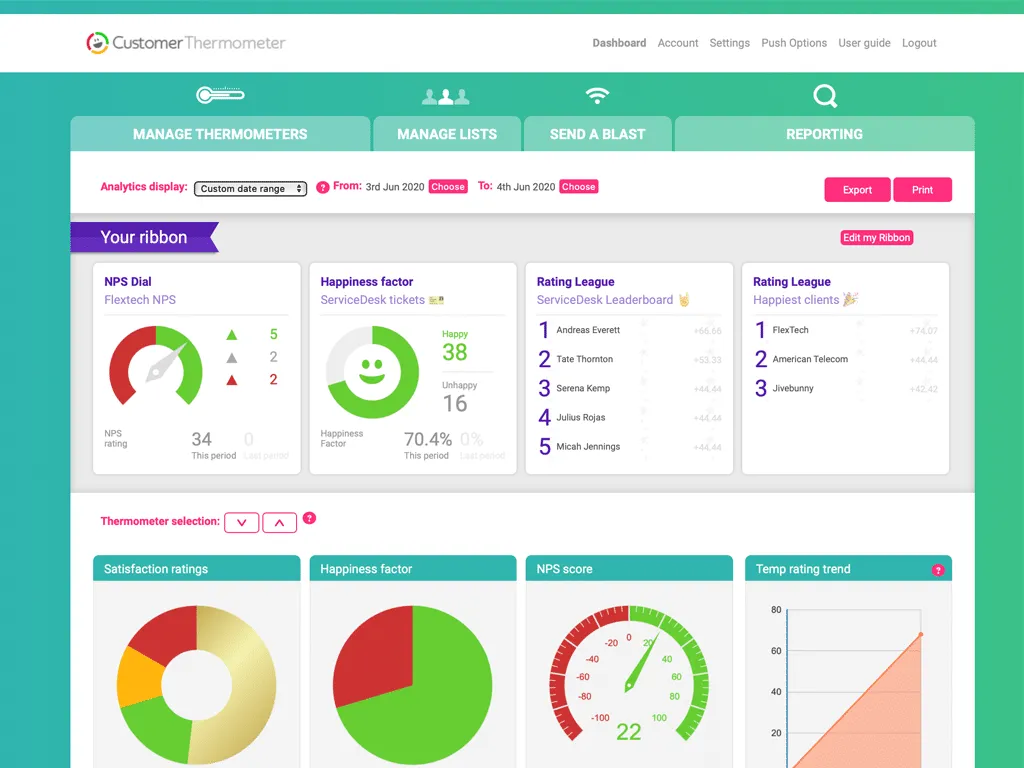
How a ServiceDesk might use Ribbon reporting
Bringing happiest customers, top-performing agents, ticket closure feedback and NPS of a specific large client front and centre.
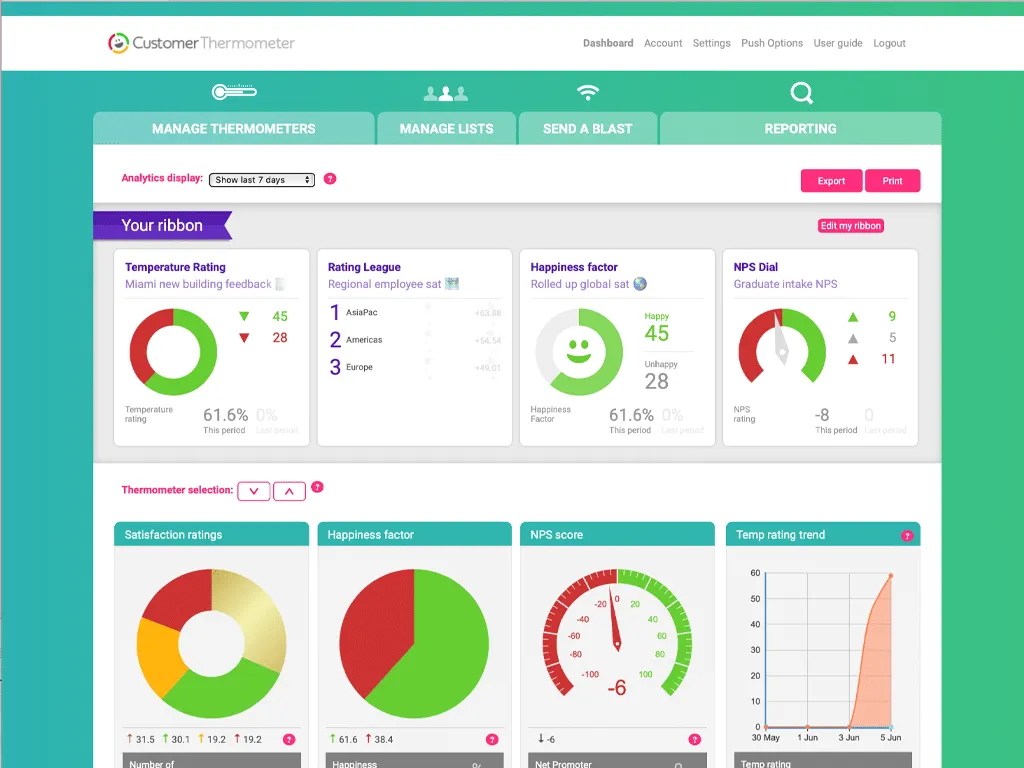
Here’s how a global HR team might use Ribbon.
Showing real time feedback on a new building just opened, regional team satisfaction, global feedback and NPS of new graduates on the intake scheme:
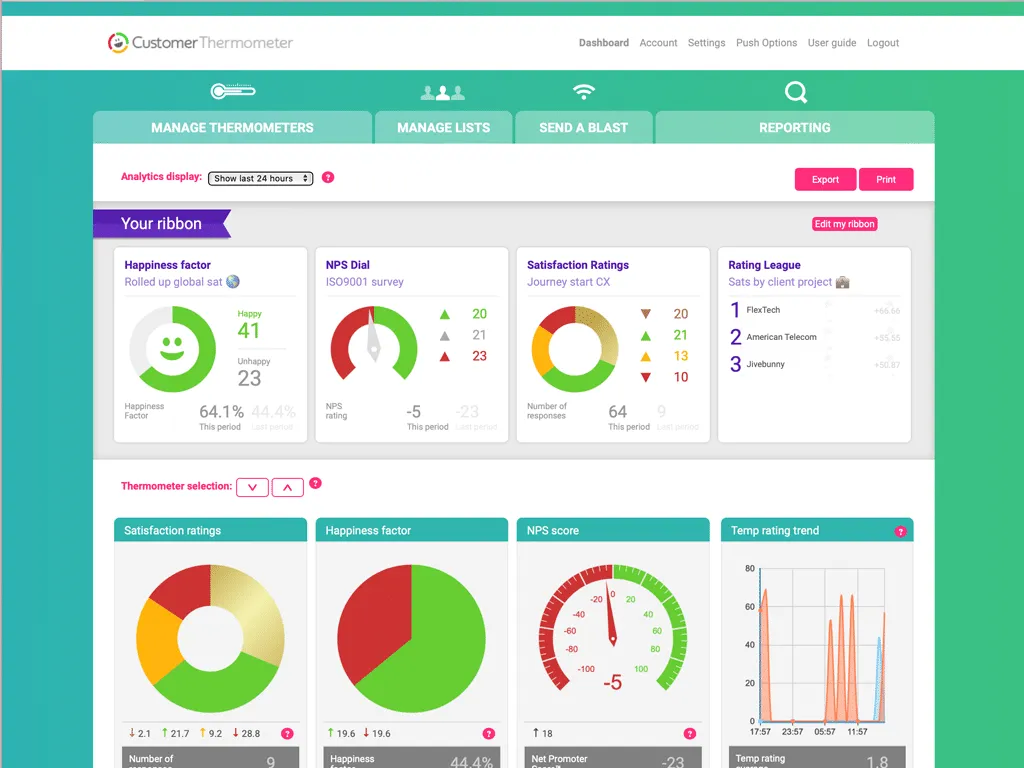
Here’s a large professional services business example
On this Ribbon, the user has pinned their global customer satisfaction, the NPS from their ISO9001 survey, project kick off CX ratings and top performing client projects by customer feedback.
These are just three examples, but with 6 different types of graphs to choose from, and the ability to filter on time, thermometer, and custom field, there are literally millions of outputs and combinations you can put together.
You simply select your report type, choose your parameters and add to your Ribbon…
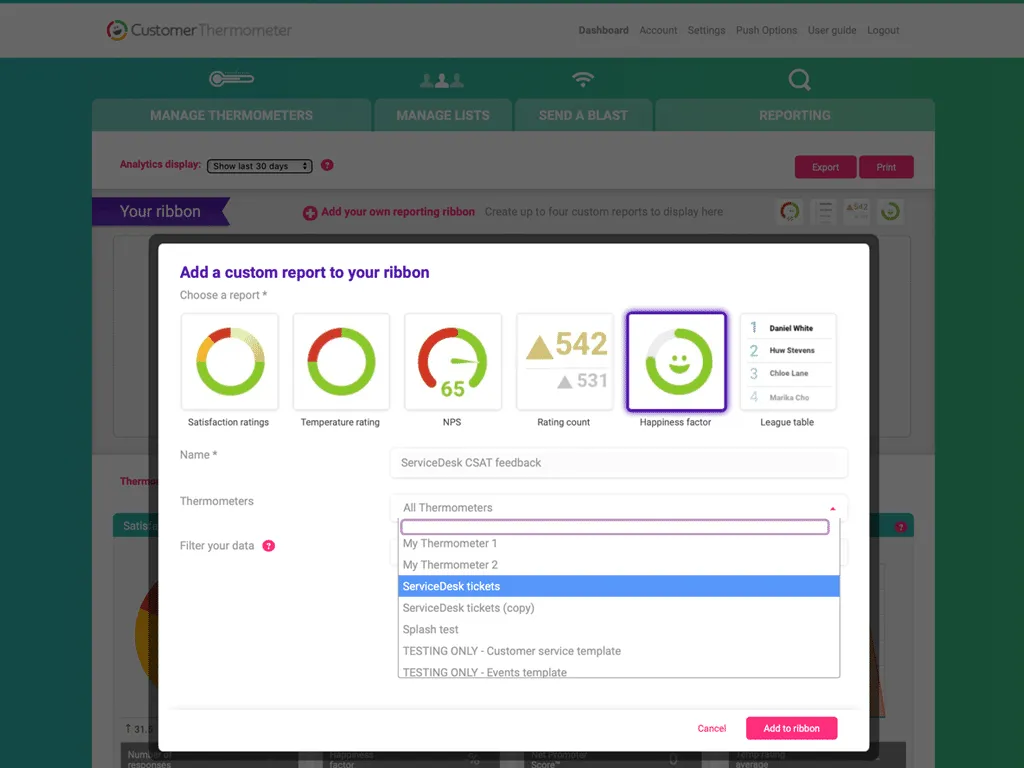
You could choose to pin:
- The most at-risk customers’ feedback to keep an eye on them in real time
- The feedback from a team or region whose feedback you want to keep track of
- Have dials for the feedback at the start and end of projects
- The NPS for key clients, or new clients just coming on board with you
- Leaderboards for critical business units
- Scorecard KPIs you report on each week or month
- Employee satisfaction in teams around the world
- Ticket and service feedback for important product or service lines…
And as always with Customer Thermometer, they all work out of the box. Just select your graph type and the data you want to see and it all just works! (Check out how to use Ribbon on our User Guide here).
Ribbon means you can see the data that’s important to you, in real time, as soon as you log in. No more having to go hunting for it. And when things change (new customers, different priorities, new KPIs) you simply swap your Ribbon reports for new ones.
This is just the beginning of a huge array of updates and improvements we’ve been working on. More will follow really soon. Please send us any feedback as you use Ribbon – we know there will be a lot of interest in this and we’re keen to capture your requirements and keen improving on this brilliant feature.